VibeChart: Your New Best Friend for Visualizing Data
Ever find yourself staring at a sea of numbers, trying to glean some insight but just feeling lost? You’re not alone. Data can be pretty intimidating, especially when you don’t have a background in analytics. But what if I told you there’s a way to transform all that raw data into easy-to-understand charts—just by describing what you need? Enter VibeChart.
Make Sense of Data with Just a Few Words
Let’s be honest. As much as we admire data scientists and analysts, most of us aren’t the numerical wizards we wish we could be. That’s where VibeChart comes in. Imagine you have a ton of information on your hands—sales numbers, customer feedback, maybe even some social media statistics.
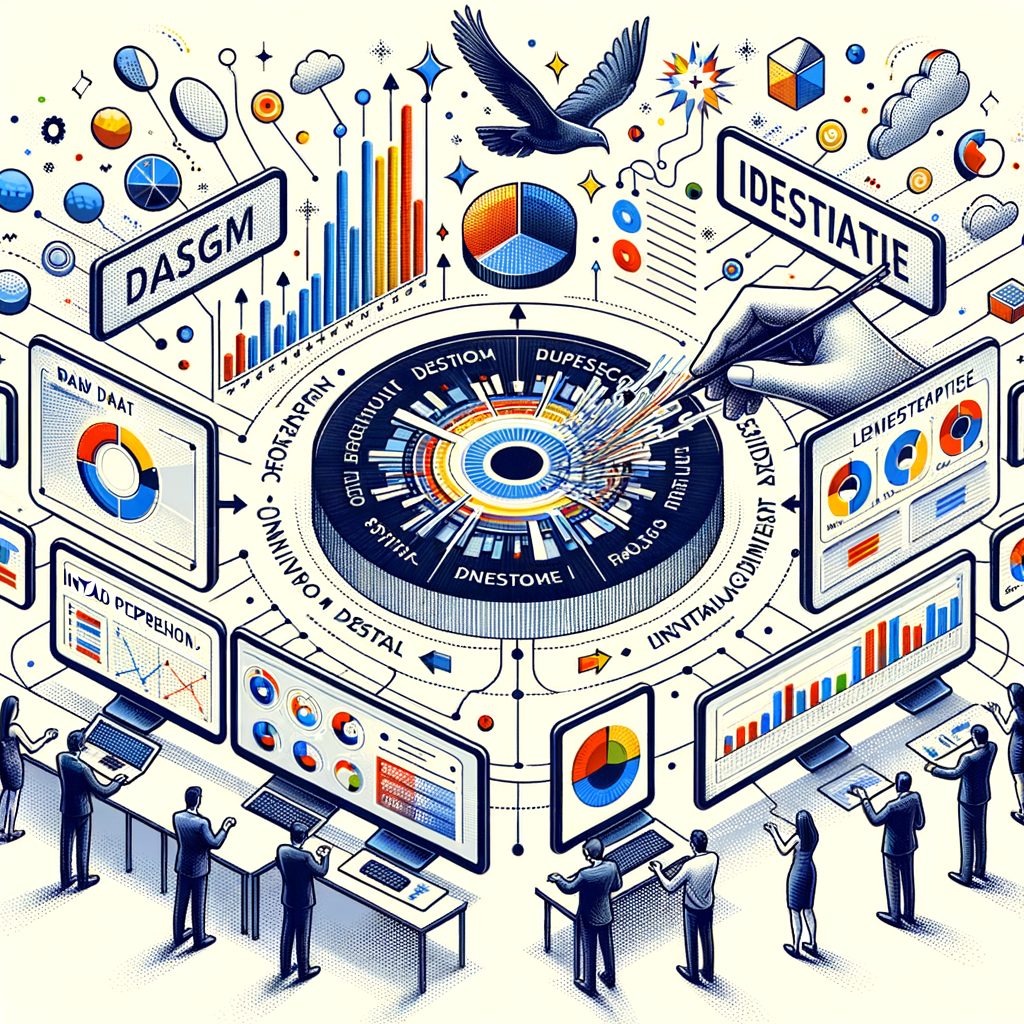
With VibeChart, all you need to do is type in your request in plain English. You can say something like, “Show me a chart of sales over the last six months by region,” and like magic, the platform turns that into a vibrant, easy-to-read visual. No coding, no complicated software to learn—just a couple of sentences, and bam! You’ve got a chart.
Why It’s Useful
Okay, so maybe you’re wondering why this matters. Well, let’s break it down.
– Time-Saving: We’re all busy, right? VibeChart can save you hours that you’d otherwise spend fiddling around with spreadsheets or trying to figure out some complex software.
– Accessibility: You don’t need to be an expert to use it. Whether you’re a small business owner, a student, or just someone curious about data, VibeChart levels the playing field.
– Clarity: Charts and visuals can help to make sense of complex data. Sometimes, seeing the information laid out visually can point you toward insights you might have missed when looking at raw numbers.
Real-World Applications
Think about how you could apply this. If you run a blog and want to analyze your readership numbers over the year, a quick description to VibeChart could produce a charming graph that highlights trends instantly. Or, if you’re working on a research project, you could create visuals to support your findings, making your presentations more engaging and persuasive.
Plus, visualized data is easier to share. I mean, which would you rather send out to your team: a dense spreadsheet or a vibrant chart that tells the story clearly? It’s a no-brainer.
How to Get Started
Getting started with VibeChart is a breeze. Simply head over to their website, and you’ll find an intuitive interface that guides you through the process. You’ll quickly see that crafting a chart isn’t just for the pros anymore—it’s something anyone can do.
As you type out your description, VibeChart helps refine your needs, ensuring the final output really captures what you’re after. You can then edit and customize the visuals to fit your style—another neat feature that personalizes the experience.
Final Thoughts
So, if you’re someone who often deals with data but doesn’t have the time or expertise to create sophisticated visuals, give VibeChart a try. It’s like having a friendly assistant who understands your needs and quickly delivers impressive results. After all, understanding your data shouldn’t feel like solving a puzzle—it should feel empowering.
In a world awash in data, finding clarity is essential. VibeChart might just be the tool you didn’t know you needed. Now go ahead, give it a shot, and watch how your insights come to life!
Source: VibeChart – https://taaft.co/vibechart-r/
Discover more from Broadhaha
Subscribe to get the latest posts sent to your email.
